Six ESG Highlights for 2026
With 2026 in full swing, many people are working to get their plans for the year moving forward. For ...

Post by Shay Shvartz, Senior Equity Research Analyst
This past Sunday saw the NFL Conference Championships, and now we know that the Philadelphia Eagles will face off against the Kansas City Chiefs in Super Bowl LIX on February 9th. While millions of fans around the world will tune in for the game itself, millions more will watch the big game for the spectacle, the halftime show, and of course, for the commercials.
Super Bowl commercials have become an integral part of the event, becoming some of the most memorable ads of all time. From the original 1984 Macintosh ad to the Budweiser “Wassup!” ads, these commercials enter the cultural lexicon like no other advertisements.
They also tend to be far more expensive than regular commercials. This list of the most expensive Super Bowl ads has all of the top 10 above $14 million to produce. The ad slot is expensive as well, with 30 second slots for this year’s game going for $7 million.
So are they worth it? That was a question we wanted to answer, so using Bridgewise analysis, we looked at the stock price of public companies that advertised during the Super Bowl.
To select the companies, we relied on lists produced by Billboard of the top commercials from the past four years. You can find their lists here: 2024, 2023, 2022, 2021.
We looked at the top ten ads as selected by Billboard from each year. We removed private companies, and in cases of ads for multiple brands we only analyzed the parent company. We then analyzed the performance of the Super Bowl commercial portfolio in comparison to the performance of the S&P 500 benchmark at one, three, and six month intervals. Dividends were excluded from the analysis.
Well, if you were hoping to pick stock winners based only on whether they advertised in the Super Bowl, you might want to reconsider.
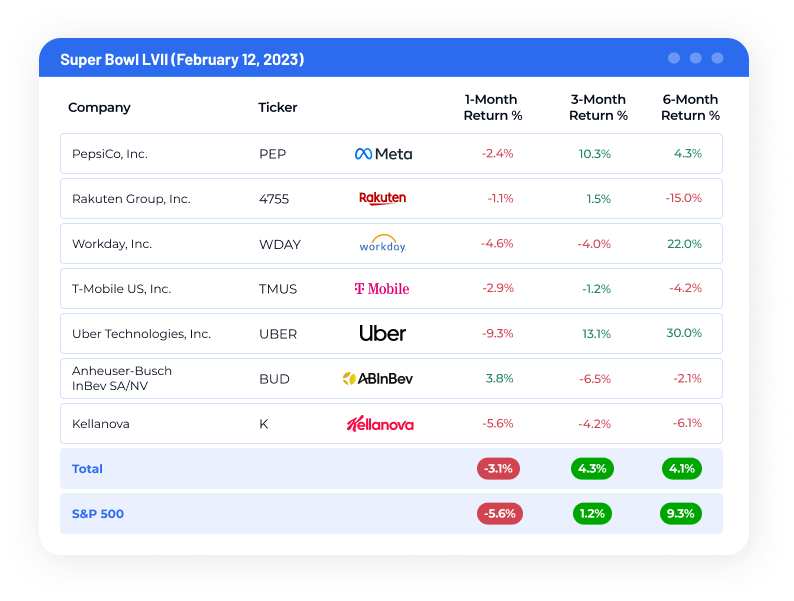
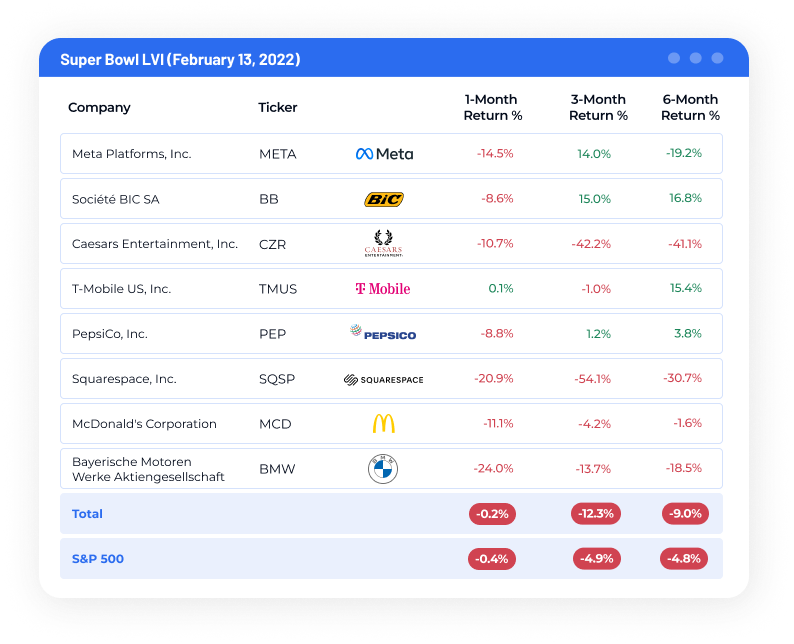
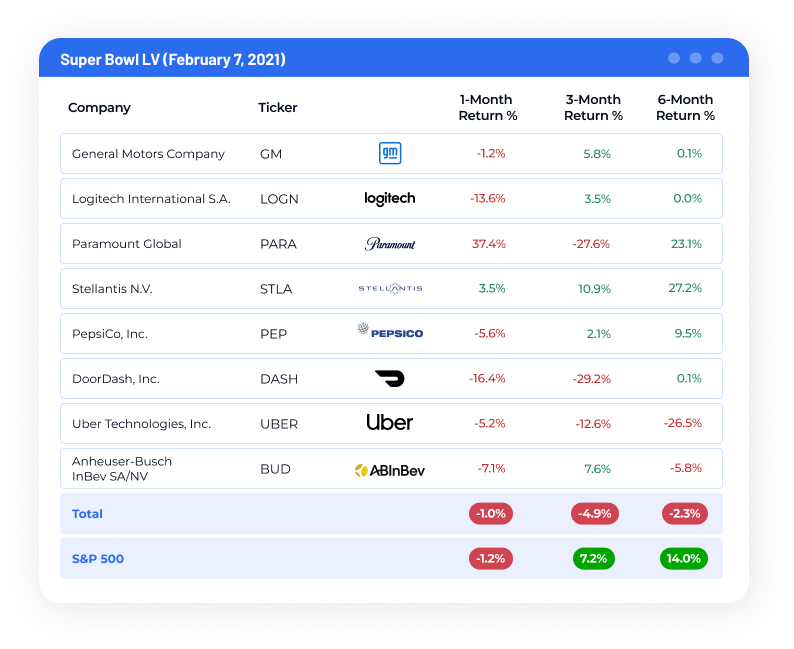
The Super Bowl portfolio tended to underperform the S&P 500 Index across all three time intervals. In fact, after six months, the Super Bowl commercial companies trailed by an average of 9.2%. Beyond that, the underperformance was fairly consistent, both over the time periods measured and across years. In only three of the 12 periods measured did the Super Bowl portfolio perform better than the S&P 500. However, by six months, the S&P 500 had higher returns in each year measured.
In addition, most of the individual companies measured underperformed the S&P 500, meaning that the overall underperformance of the Super Bowl portfolio wasn’t caused by a few outliers. In only 35% of the cases, did a stock outperform the S&P 500 in one of the measured time periods, and in only 25% of cases did they perform better after six months.
You can see the results clearly in the charts below:


Regarding the stocks that did outperform the S&P, there isn’t a clear pattern to them. They range from telecoms such as T-Mobile, to tech companies like Uber, and even traditional industrials such as automaker Stellantis (with its Jeep brand being advertised in 2021).
It’s hard to pin the performance of these stocks on any one factor, and that’s potentially the biggest takeaway. Despite all the buzz and flash and the high costs of a Super Bowl advertisement, there’s no clear benefit to be gained, at least not from a stock price perspective.
That doesn’t rule out other long term factors from the ads that could drive growth, but it seems that a Super Bowl ad isn’t a clear formula for boosting the stock price.
Looking at the performance of the Super Bowl portfolio is another sign that the clearest indicator of a stock’s performance is its fundamentals – not a flashy ad or a gut feeling, but the same metrics that have been used to measure stock performance for decades.
This idea recalls a quote from legendary football coach Vince Lombardi: “The only place success comes before work is in the dictionary.” There’s no shortcut to success; not on the playing field, not in the business world, and certainly not when it comes to investing.
That’s why fundamental measurements form the core of Bridgewise AI analysis. Our Equitywise solution looks at more than 280 fundamental data points across more than 20 years of historical data to provide in-depth fundamental and technical analysis on more than 90% of global equities.
It’s also these core factors that form the basis for Bridgewise buy/sell recommendations. This objective standard is one key benefit of leveraging AI for stock analysis and can remove some of the bias found in traditional analysis to say nothing of the gut feelings that might underpin a strategy that leverages Super Bowl advertisements as an indicator of strength.
Regardless, whether you invest in companies that advertise during the Super Bowl, it seems like a safe bet to dig deeper than how cool their ad is. Reliable investment intelligence and analysis is a critical part of a smart investing strategy and AI is emerging as a leading source for investors to gain insights and discover opportunities.
To learn more about Bridgewise and how we can help your investors find investment opportunities, sign up for a demo today.
*Important notes: The information concluded in this analysis is intended for general guidance purposes only. Under no circumstances is the information adjusted to a specific factor or variable related to the identity of the reader. The information is not a substitute for specific advice that takes into consideration the specific data and special needs of each reader, and in any case, it is recommended to consult with professionals and tax advisors in these contexts.

With 2026 in full swing, many people are working to get their plans for the year moving forward. For ...

Generative AI has moved quickly from experimentation to production, but in financial services, ...

BridgeWise , the global leader in AI for investments, has today announced an international ...