
Six ESG Highlights for 2026
With 2026 in full swing, many people are working to get their plans for the year moving forward. For ...
The votes are still being counted, but as of this writing in the morning of Wednesday, November 6th, all signs are pointing to Donald Trump being reelected as President of the United States. Along with that, it looks like the Republicans will take back control of the Senate and make gains in the house.
The implications for the US and the world from the outcome of the election are of course significant, and it seems like their full impact will only be made clear as the new administration takes over.
One significant issue that came to light in driving the results was Americans’ view on the economy, with half of voters reporting they were worse off economically than four years ago. With economic questions front and center, there’s an opportunity to ask another question: which party has the better investors? This might seem irrelevant at first glance since the skill of politicians at investing doesn’t necessarily indicate their skill at leading the country.
However, there is an option out there for investors looking to copy the portfolios of the two main political parties. In 2023, Subversive Capital unveiled two ETFs that followed an unusual investment strategy – the investments held by members of the US Congress and their spouses. The two funds, NANC and KRUZ (see what they did there) provide the industry with a unique insight into the investment patterns of political leaders.
Fortunately, at BridgeWise we have FundWise, our analysis tool that can help investors research and compare ETFs while gaining a deeper understanding of their underlying assets. We took a look at these two funds to get a sense of how they are performing compared to each other, the market, and to gain some insight into the kinds of investments congress members are choosing.
So how are these two ETFs performing compared to each other, and the market overall. In short, pretty well. Both funds have overall positive Bridgewise ratings, with each receiving an Outperform rating from our analysis.
In terms of returns, NANC is out ahead with 36% over the past year. KRUZ and the Republicans are a bit behind with 24% over the last 12 months. KRUZ is also sitting at a lower beta when compared to NANC and is also losing in comparison to the standard S&P 500 benchmark.
KRUZ Performance

—-
NANC Performance

So what’s driving the difference in performance? One strong factor is the large weight of tech stocks held by Democrats. You can see how tech companies make up more than 40% of NANC while only representing ~20% of KRUZ.
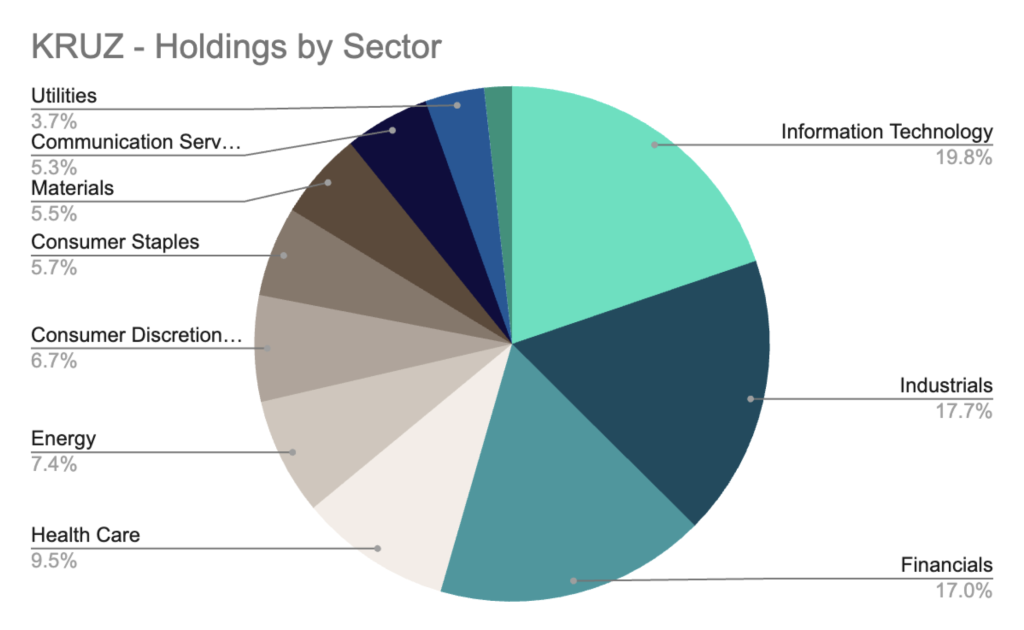
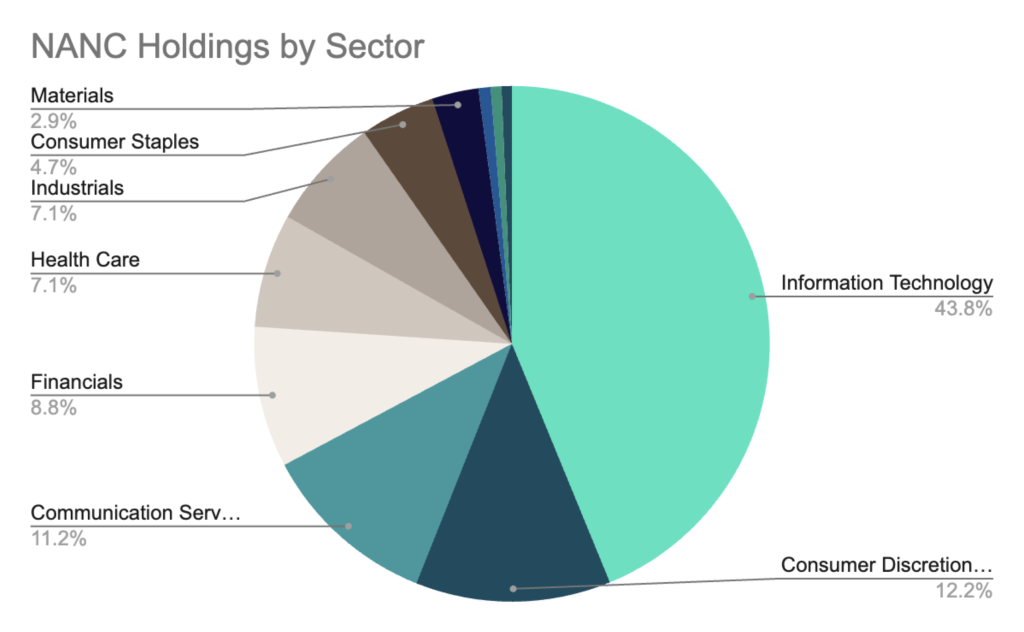
When looking at the top holdings, NANC shows familiar tech giants at the top that mirror leading indexes such as the S&P 500.
However, with KRUZ, the top spots are held by companies from the financial sector, energy and smaller cap companies such as Comfort Systems (FIX). These may represent large company stakes held by individual congresspeople, or perhaps a trend amongst Republicans to try their hand at stock picking rather than following popular indexes.
Of course, near the top for both funds is NVIDIA, which has driven a large part of the growth for the market as a whole and is found in most leading funds and these two are no exemption.
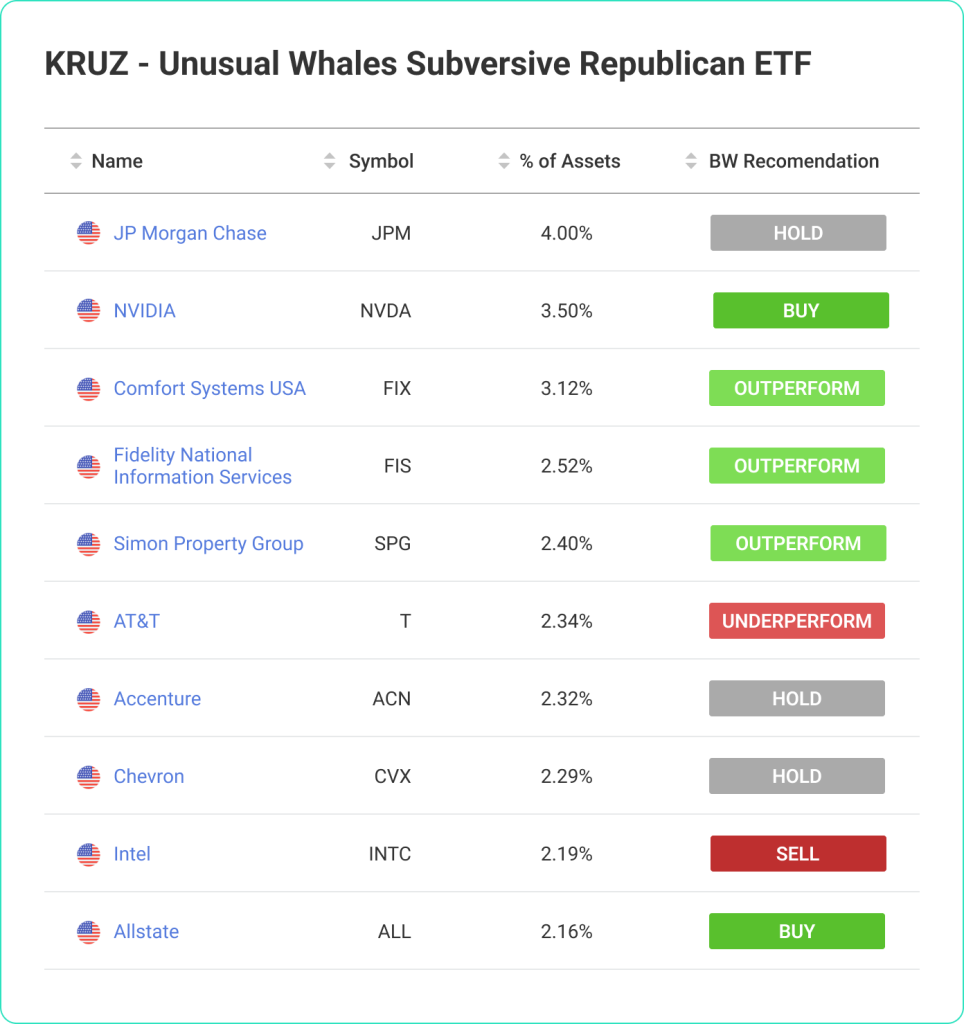
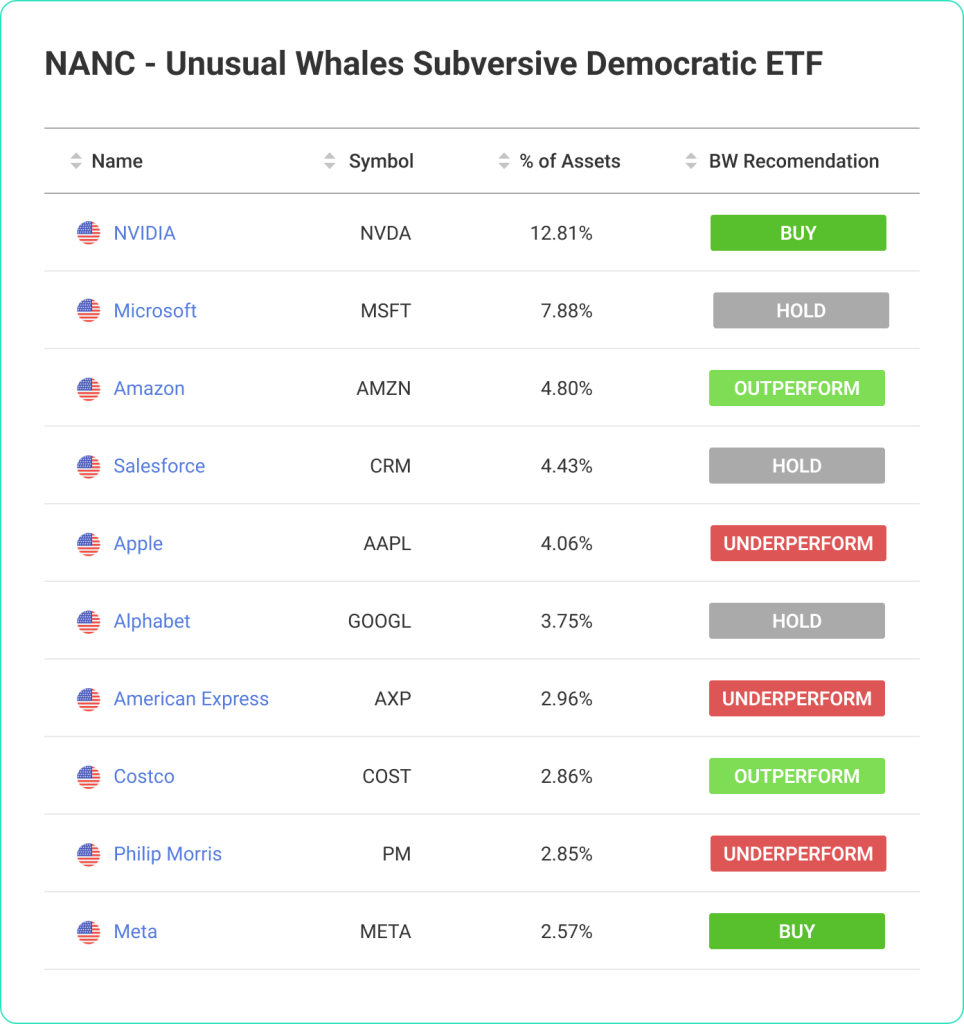
In the charts above you can see one unique perspective that FundWise provides, specifically the Bridgewise recommendation for each asset in a fund. Here we can see that despite its performance over the past year, the top holdings in NANC are rated somewhat lower than the top assets in KRUZ.
While one might expect, depending on your political inclination, for there to be major differences in the ESG score of the underlying assets, we didn’t see major differences between the two funds with each achieving an average ESG score of around 63. There were differences at the top with the leading NANC assets scoring slightly higher on average.
It may take time for the results of the election to become clear, either from the perspective of the votes themselves or from the perspective of what impact the new leaders will have. However, looking at the investment choices of the parties offers one way to gain insight into their decision making, and what those decisions mean for all of us.

With 2026 in full swing, many people are working to get their plans for the year moving forward. For ...

Generative AI has moved quickly from experimentation to production, but in financial services, ...

BridgeWise , the global leader in AI for investments, has today announced an international ...